Highs and lows

Egyszer fent, egyszer lent

2023. február 01. - László Józsa Alexandra

HU version below ↓↓↓

A cikk magyar nyelven Tovább kattintva lentebb olvasható.

---

6 minutes reading time ||| 6 perc olvasási idő

EN version


The year 2022 will most probably remain remembered as the year of ups and downs, especially on the energy markets. Europe saw an unprecedented increase and/or the decrease of prices, volatility, consumption, liquidity, margin requirements, storage levels, pipeline supplies, LNG inflows or even temperatures.

The below chart provides a schematic overview of the past calendar year from the perspective of natural gas markets, while the article provides a more detailed summary of the most important events.

Chart 1: Price movements and main market drivers in 2022
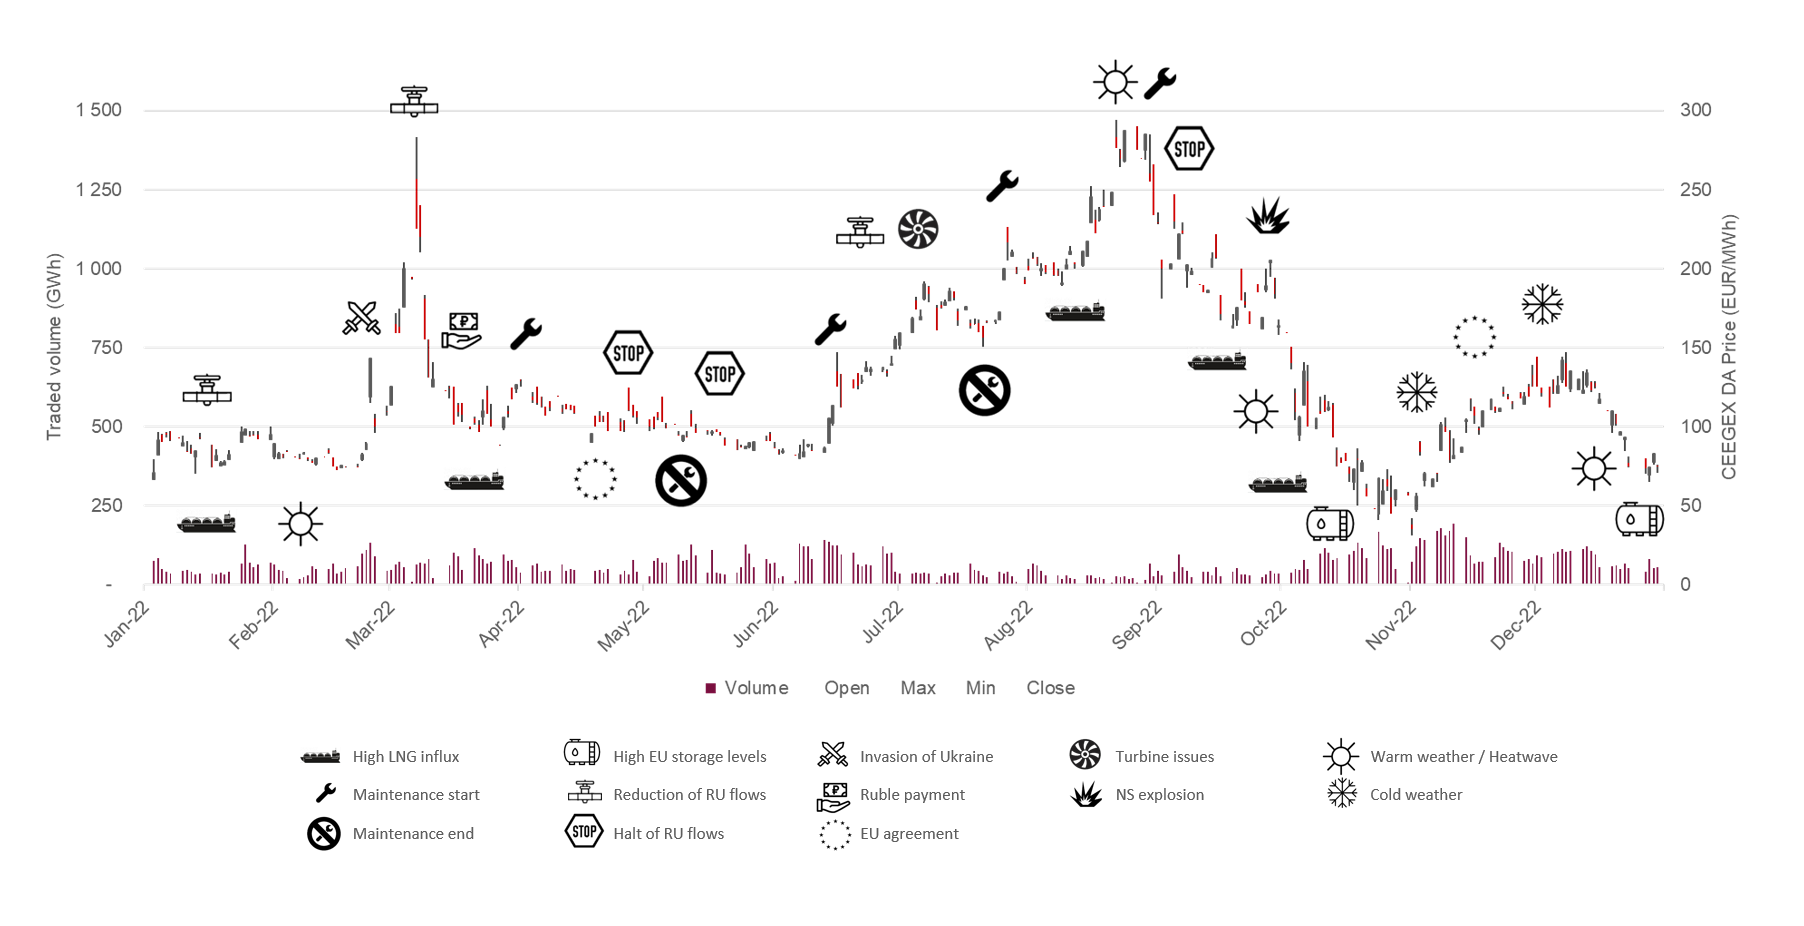
Last January European governments were mostly busy with finding ways to curb the rise of household energy prices. At that time the main driver of bullish prices was supply tightness – Russian imports almost halved at the beginning of the year compared to January 2021 and EU aggregated storages were depleted at a nearly record low 53% level.

Russian military drills on the Ukraine border and the suspension of Nord Stream 2 certification had already sparked fears, but on 24 February prices rose by around 40% within a day right after the invasion. Gas markets further surged at the beginning of March and hit an all-time high, rising above the 200 EUR/MWh psychological threshold when it became evident that Russia would not withdraw in spite of the sanctions. The market priced in the risk of a halt in Russian supplies either due to damage of key infrastructure or due to Russia deliberately stopping the flows.

Nonetheless, prices corrected down in March on ample LNG and as Russian flows (mostly via the Nord Stream 1 pipeline) remained stable. Still, prices could not return to the pre-war level. Further sanctions were announced, like the exclusion of Russian banks from the SWIFT payment system, major international energy companies walked away from Russian energy projects. The Commission unveiled its REPowerEU plan to reduce the block’s reliance of Russian gas by two thirds by the end of 2022, while the Russian president announced ruble payment for ‘unfriendly’ countries.

In the upcoming two months Russia sanctioned the owner of the Polish section of the Yamal pipeline and suspended supplies to five European countries, which refrained from paying in the Russian currency. As all of them were able to replace Russian gas quickly, prices and volatility could have remained relatively moderated. Even though Norwegian maintenances commenced and both Germany and Austria triggered the first stage of gas emergency, the record high LNG flooding to Europe (primarily from the US), muted LNG demand from Asia (due to COVID lockdowns in China) and accelerating new infrastructure developments and diversification efforts of EU member countries kept a lid on prices.

And then the summer maintenance period kicked in reducing Russian flows and bringing back the bullish sentiment. In June flows on the Nord Stream 1 pipeline dropped to 40% of capacity due to turbine issues, just a month before the planned annual maintenance when flows stopped for ten days. Soon supplies were suspended also on the TurkStream during a seven-day planned maintenance, moreover one of the largest US LNG terminals (Freeport) went offline for months after a fire accident.

In July Nord Stream 1 supplies were restricted to 20% of capacity because of turbine documentation problems, notwithstanding the repairing country Canada had already exempted the turbines from sanctions. By the end of August a three-day outage was announced on the same pipeline, which later proved to be permanent. The Nord Stream 1 halt was the last straw on top of Norwegian outages, weeks of heatwaves and weak wind generation. The drought not only resulted an increase in power demand, but low river levels reduced coal shipments to Germany and limited nuclear capacity in France. By the way, 2022 was Europe’s second-warmest year so far. The heightened injection demand deriving from the 85% storage level obligation added further stimulus. This was the point when LNG supplies and the 15% gas saving obligation could not mitigate the bullish factors anymore and gas prices skyrocketed to never seen levels above 300 EUR/MWh.

However, September broke this trend as aggregated EU storage levels surpassed 80%, new infrastructure came online (Baltic Pipeline, IGB, Eemshaven FSRU) and demand destruction became more and more visible. The Commission’s announcement of emergency energy market interventions, like revenue caps, joint gas buying, a new LNG index or the idea of an EU wide price cap also resulted selling activity on gas markets. Market participants became such confident about sufficient gas reserves for the winter that the explosion on the Nord Stream 1 and 2 pipelines could not spur back prices to their August levels.

With the start of the gas year markets gradually cooled down as above average temperatures, improved renewable output and curbed demand delayed the start of withdrawals by one month. At the same time remaining Russian supplies were not suspended – despite previous threats in case Europe approved a cap on gas prices. Moreover, LNG deliveries from the US, Algeria, Qatar and even Russia ramped up resulting in a short glut around the ports of Spain. Northwest European LNG terminals were running on almost full send-out capacities, while storage levels approached 100%. New FSRU terminals (Wilhelmshaven) and interconnectors (e.g. PLSK) became operational, which in turn triggered changes in the traditional gas routes within Europe.

But together with prices both industrial and household consumption also lowered as a consequence of formerly high energy prices and energy efficiency measures. Between August and November the decrease of the average gas consumption of the European Union exceeded the 15% target, in some countries reaching 50% versus the five-year average. Although the cold spell in the first half of December resulted in a rise in heating demand and higher pace of storage withdrawals, but later storages in several European countries turned to injection mode thanks to the mild weather during the holiday season. It is emblematic that the EU’s gas crisis package was accepted on 19 December at pre-war price levels and storage levels above 80%.

Trading activity on the European exchanges was also severely affected by record high prices and extreme volatility. Liquidity from OTC markets shifted to the exchanges despite higher margin requirements so that market participants avoided the rising counterparty risk. Even with the increased liquidity on certain European hubs and a shift to spot trading, European traded volumes on overall decreased roughly by 20%, mostly driven by a throw-back on TTF futures markets.

To wrap up 2022, from the very beginning of the year the tension was up and markets were buoyed by fears of dropping Russian volumes, prices reacted fiercely on any news relating to the supply and demand. But as Europe approached the new heating season with higher and higher storage levels combined with unseasonably mild temperatures, record high LNG influx and lowering demand the market sentiment also calmed down.

---
Tovább

MGP index

"Magyar szerződésbe magyar indexet!"

HU version below ↓↓↓
A cikk magyar nyelven Tovább kattintva lentebb olvasható.

 ---

4 minutes reading time ||| 4 perc olvasási idő

EN version

It’s that time of the year again to conclude gas supply contracts. Both retail and wholesale markets are on a bumpy road for a year with exceptional high prices and exceptional volatile prices. The latter one is often overlooked, however in these conditions risk management strategies are directly affected by price volatility. Let’s take a glance at a novel solution: using MGP index in Hungary.

For years it has been common that consumers receive offers including either fix prices, front month indexed prices, spot prices or a mixture of these. From the client’s perspective the fix price results the most predictable cashflow, while the spot price is the most unpredictable. Talking about risks the front month index is somewhere in between. Nonetheless, a flexible price index leaves the possibility to benefit from falling prices. In practical terms – i.e. in Hungary – the relevant hubs mean TTF for the front month index, while spot prices used to be the formula of Dutch TTF + spread or Austrian VTP + spread and increasingly MGP (Hungarian Virtual Point).

Switching to MGP does have a moment now as the above-mentioned spreads have also become hectic recently.

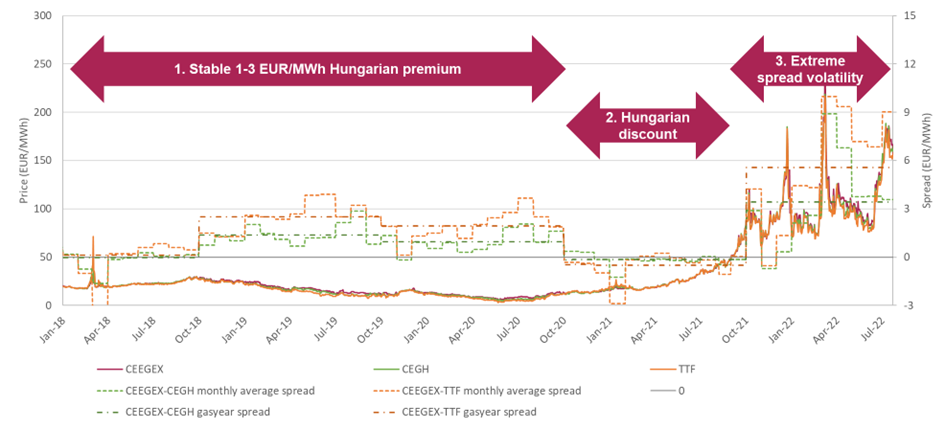
Chart 1: CEEGEX (MGP), CEGH (VTP) & TTF DA prices and average spreads (2018-2022)


The historical evolution of TTF-MGP and VTP-MGP spreads can be divided into three phases:

  1. Old world order: stable 1-3 EUR/MWh premium in Hungary compared to Western markets. This was in line with the transport costs, even though direct Dutch-Hungarian transport agreements were rare, but the Austrian-Hungarian interconnector was always fully utilized
  2. MGP discount: with the appearance of Croatian LNG and the startup of RS>HU interconnector, the supply-demand equilibrium has changed, as discussed in this post
  3. Extreme spread volatility: because of rising risks and volatile gas prices, present day

It’s still unpredictable how long will the third phase last. An important factor is that gas markets are not just globally connected, but local events result local spikes, e.g. lower NordStream 1 flows more directly affect TTF price, while VTP or MGP prices can be more resistant with the stable – or even higher – Southern flows. These local specialties are also differently shaping the daily prices in Austria and Hungary.

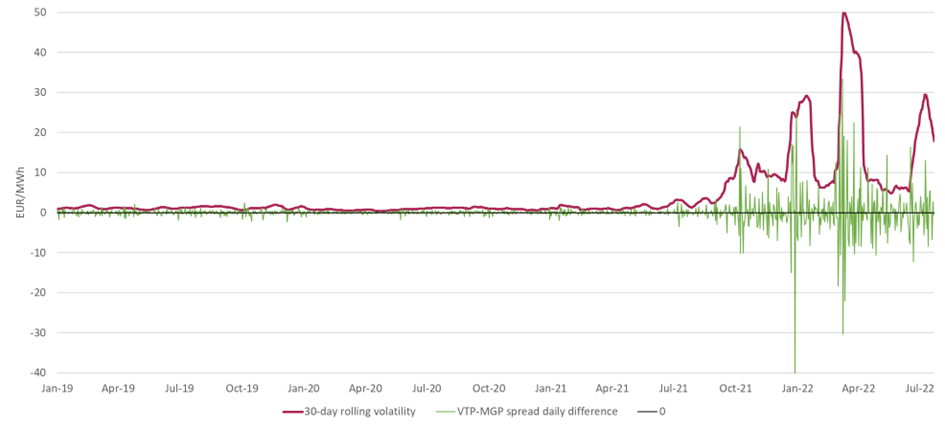
Chart 2: VTP-MGP daily spread and rolling volatility

Chart 2 shows the highly unusual spread volatility. This is reflected in multiple areas:

  • The accepted level of cost of natural gas procurement for distinct heating is TTF + spread, where the spread will be 25 EUR/MWh from 1st October 2022, compared to previously common 1-3 EUR/MWh
  • Market participants expect spread in a very wide range, which means around 5-15 EUR/MWh for VTP and 10-25 EUR/MWh for TTF
  • In this gas year the monthly average CEEGEX-TTF spreads ranged between -0.5 and 10 EUR/MWh, while the monthly average CEEGEX-VTP spreads ranged between -1 and 9 EUR/MWh (as seen on Chart 1)

Minimizing the risk due to high spread volatility can be achieved with a novel solution both from consumers’ and wholesale traders’ perspective: use as local index as possible. The good news comes with the stabilized Hungarian spot market liquidity on CEEGEX around 30 TWh or 3 bcm per year, which is more than half of the domestic industrial consumption. If a gas supply contract includes full or partial spot indexation, then CEEGEX prices are the best solution in Hungary instead of TTF DA or VTP DA. Consequently, CEEGEX prices mean a genuine input for ICIS MGP price assessment, while more and more market participants already offer consumer contracts with CEEGEX prices. A personal opinion that this is good for the market and for the consumers too, and these traders with this niche idea will build an advantage compared to others.

 ---

HU version >>>
A cikk magyar nyelven Tovább kattintva lentebb olvasható.

Tovább

What price do we pay for gas?

Mi az ára a magas gázáraknak?

HU version below ↓↓↓
A cikk magyar nyelven Tovább kattintva lentebb olvasható.

 ---

3 minutes reading time ||| 3 perc olvasási idő

EN version

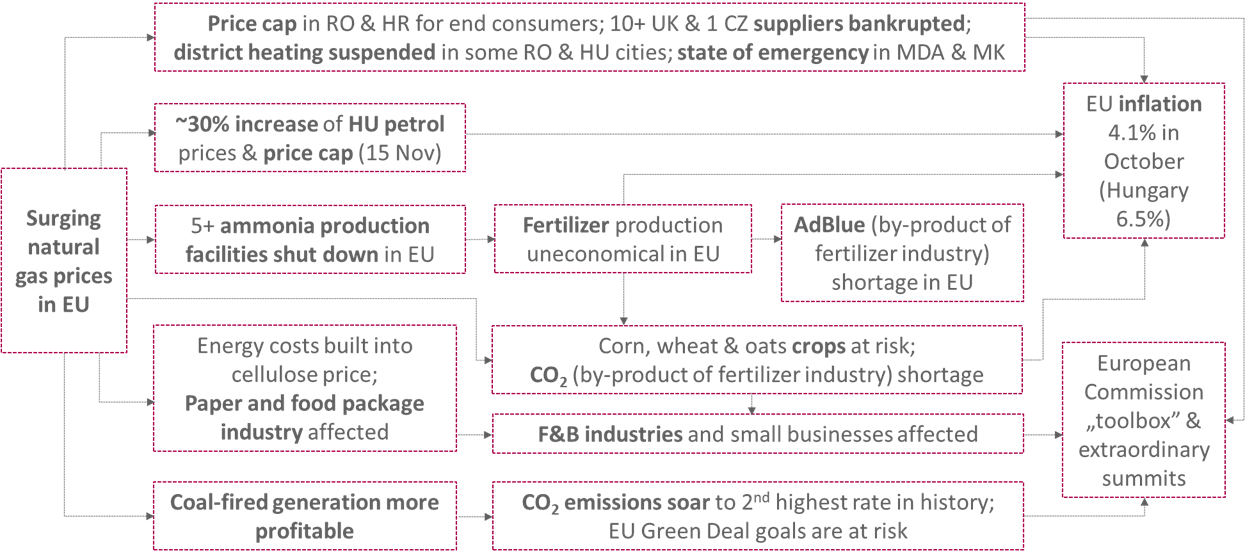
The second part of this year was dominated by news related to bullish energy markets, including spiking gas prices and extreme price volatility. Causes have been explained in detail by many sources, but few did summarize the aftermath of soaring gas prices and how they affect our everyday lives. Present article attempts to illustrate some of the most important consequences in Europe and the CEE region that were triggered by surging gas prices.

Chart 1: Consequences of high gas prices

Although wholesale natural gas prices started increasing in Q2 2021, real aftermath became more visible in Q4 2021. In October several energy companies collapsed in the United Kingdom leaving more than 2 million end consumers without a supplier, similarly a major energy supplier in the Czech Republic had to shut down, as well. Furthermore, Timisoara and Szolnok had to suspend district heating right at heating season’s start.

Shortly after these events, many governments started to implement measures to protect households and businesses. Hence, Romania introduced a price cap on natural gas to prevent consumers from defaulting on their energy bills, while Croatia and Hungary announced maximum values of petrol prices. Also as a consequence of the energy crisis, North Macedonia declared a 30-day state of emergency on 9 November, and before that Moldova had been in a state of emergency until the new long-term gas deal with Russia was signed.

Effects of skyrocketing gas prices are not only felt among domestic end users, but also industrial and agricultural sectors are heavily affected. First to feel effects are the energy-intensive companies. For example, natural gas is a key component for manufacturing ammonia, therefore increased production costs have forced several ammonia plants in Europe to shut down, while fertilizer production has also became uneconomical at many sites. This in turn means higher costs for farmers contributing to price increase of food products. No wonder that French farmers were told to leave corn crops unharvested as drying corns requires natural gas. Such events directly contribute to the food price inflation.

Hampering fertilizer production caused the shortage of its by-products, such as AdBlue or CO2. AdBlue is a diesel fuel additive and its deficit together with rising fuel prices threatens road freight transportation. CO2 is crucial for food and beverage (F&B) industries, and is used to carbonate beverages or extend the freshness of products.

Energy-intensive industries, like paper or food packaging production, are similarly exposed to gas price movements and are subsequently causing prices of other final products to go up. Therefore, the effects of gas prices are all encompassing and can hurt business of all sizes, small and medium-sized enterprises might be the most vulnerable in the current price environment.

Finally, we should not forget about the environmental implications. 2050 carbon neutrality goals might be in jeopardy as the profitability of coal-fired generation has started to surge over the gas-fired power plants, thus high natural gas prices caused CO2 emission levels rebound to their second highest value to date in October.

On 13 October – as a quick response – the European Commission presented a “toolbox” including short and mid-term measures to mitigate the energy crisis without endangering Green Deal goals. Shortly after the European Council held an extraordinary summit on 21-22 October leaving energy ministers to discuss the details and implementation of the possibly measures. The only outcome is to leave the possibility for European countries to manage the crisis on their own. As consensus was not reached in EU measures, many further talks will follow.

In consequence of the above, annual inflation in the Eurozone rose sharply to 4.1% in October up from 3.4% in September, while in Hungary it hit a 9-year record at 6.5%. Annual inflation shows the rate of price change of goods and services, hence soaring gas prices had contributed to the price increase of different types of products and services.

The article aimed to provide a snapshot of the current situation and focuses on consequences related to the natural gas prices, whereas potential long-term effects or implications caused by other commodity markets were not investigated. Nonetheless, some of the latest headlines are already projecting further price increase of food products, building materials and the bankruptcy of more companies with receiving their first energy invoices of the new gas year and early next year.

 ---

HU version >>>
A cikk magyar nyelven Tovább kattintva lentebb olvasható.

Tovább

Raging bull

The main drivers of the current extreme price environment

HU version below ↓↓↓
A cikk magyar nyelven Tovább kattintva lentebb olvasható.
 ---

8 minutes reading time ||| 8 perc olvasási idő

EN version

At the time of writing, the European gas market is in a turbulent, panic-like mood. European day-ahead gas prices are at record highs. On CEEGEX on 7 October, the end-of-day reference price was EUR 120.60/MWh and the best bid was EUR 150/MWh. Although prices have been falling day by day since then, we are still far from the normal market environment we are used to. In the following, we look at how the gas market got here.

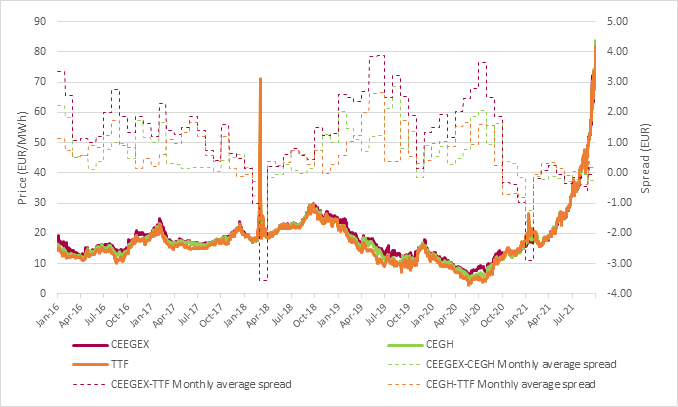
 Chart 1: CEEGEX, CEGH & TTF DA prices and monthly average spreads (2016-2021 October)

In recent years, several spikes have had major impacts on gas prices in Europe, but in most cases this has not been sustained and prices have returned to their usual levels of around EUR 20/MWh. If we look at the price movements over the last 5 years, the outlier in the positive direction was the Beast from the East event and in the negative direction the economic downturn related to the COVID-19 pandemic.

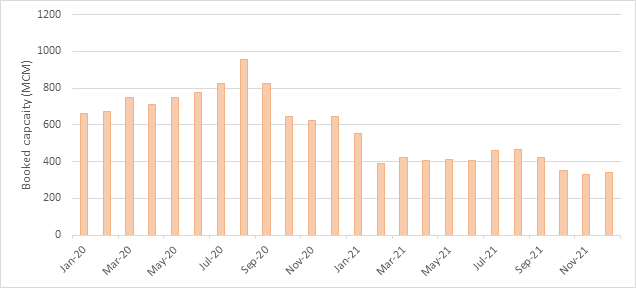
However, for 2021, this seasonality is not present at all. The year itself started with a small spike when a sudden surge in energy demand in Asia caused a visible price increase. This was followed by a shorter correction, while the prolonged cold weather in April meant that the summer gas season did not bring a fall in gas prices. In addition, the impact on market sentiment of the news of the completion of Nord Stream 2 (introduction and then withdrawal of US sanctions) has increased since the beginning of the year. This has been compounded by the fact that Gazprom has not book extra interruptible capacity on the Ukrainian route above the minimum contracted volumes since spring.

 Chart 2: Russian capacity bookings in Ukraine according to GTSO

According to ENTSOG and the Ukrainian GTSO, Gazprom also did not book extra capacity in the Ukrainian direction during the periods when Yamal and Nord Stream 1 were operating at reduced capacity due to maintenance.

 Chart 3: The gas flows of the main Russian pipelines

This was followed by an accident in August when a fire at a processing plant in a Siberian field led to a reduction in the gas flows of the Yamal pipeline, leaving EU countries with a supply shortage. Due to the prolonged cold winter, storage facilities have started to be filled from multi-year minimum levels. However, due to the high price environment caused by the supply shortage, the process was essentially slow and EU storage levels did not reach the 2020 level by the start of the new gas year.

 Chart 4: EU, Hungarian and Ukrainian storage levels in 2020 and 2021

EUA prices have also started to rise in line with gas prices and have broken several records this year. The fact that the price of natural gas has been the main driver of the EUA price increase during this period is illustrated by the case of Gascade, a German TSO, which accidentally published false flow data on its website in August, one month before the completion of the Nord Stream 2 pipeline. Although the news was not true, the markets reacted significantly and we immediately saw a drop of around 10%  in the price of natural gas, followed by the EUA pricedrop. Once it became clear that the data was wrong, the price soon started to rise again.

Chart 5: The EUA Dec-21 and the gas DA prices in August and September

1. - Siberian fire related gas flow reduction on Yamal
2. - False flow data on Nord Stream 2
3. - German court decision
4. - Nord Stream 2 completion and Sergey Lavrov's statement
5. - Decline in gas transported via Yamal pipeline

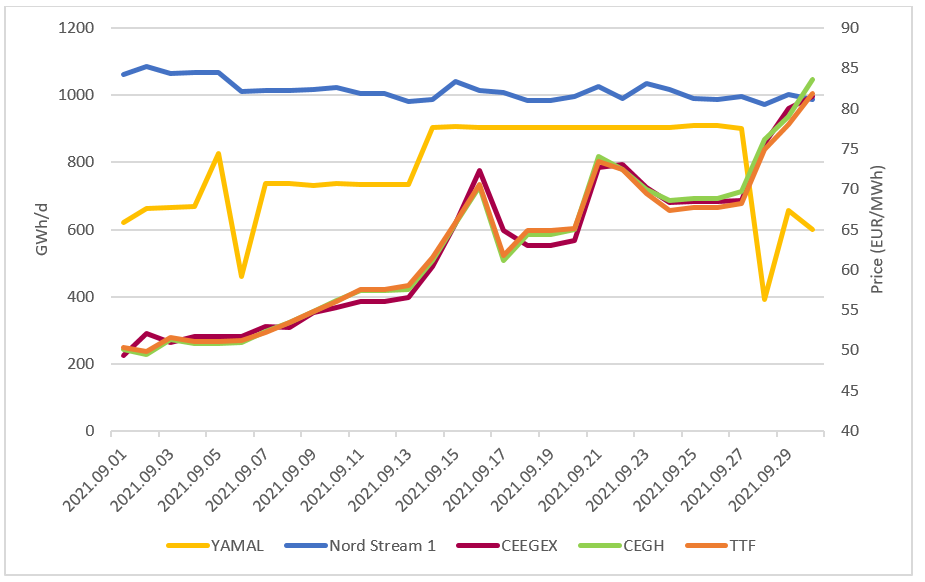
The EUA and the price of natural gas have been clearly eclipsed by the end of the summer by news of Russian supplies. The price of natural gas was also very much influenced by the question of when the Nord Stream 2 pipeline would be commissioned and when actual physical deliveries would start. However, when the German court rejected Nord Stream 2 AG's complain, meaning that the pipeline is still not compliant with EU regulations and will not be exempted from them, the price of natural gas started to rise again. This took on notable proportions in September, when Russian Foreign Minister Sergey Lavrov said on 15 September that because the Nord Stream 2 approval process would take around four months, the expected commissioning of the pipeline was scheduled for 2022.  In the following days , the price of natural gas reached the EUR 70 level. This was followed by 28 September, when the gas flows on Yamal pipeline halved, and then fell further on 2 October. These events all contributed to the accelerating rise in European gas prices in 2021.

Chart 6: Main gas flows from Russia (without Ukraine) and the DA prices

The last historic price increase was caused by the Beast from the East cold spell, when the price of natural gas on the TTF crossed the EUR 70 level for a single day. This was due to much colder than usual weather in Western European countries, the already lower production levels at the Groningen gas fields, lower than usual storage levels and the Stockholm arbitration court ruling against Gazprom, which led the Russian export monopoly to consider terminating its transit contract with Ukraine. The high demand caused by the weather and the news of a potential drop in imports to Russia, coupled with low storage levels, pushed gas prices to record highs. In addition to this, if we look at the spreads between the three hubs, we can see that the rise has affected different countries differently, so this was more of a regional shock. As in 2018, European storage levels are currently lower than usual, a cold winter is also forecasted, and there is also a major conflict at the heart the routes for Russian gas in order to export and bypass Ukraine (Nord Stream 2 licensing, TurkStream and the associated Balkan route commissioning). However, there is also another factor.

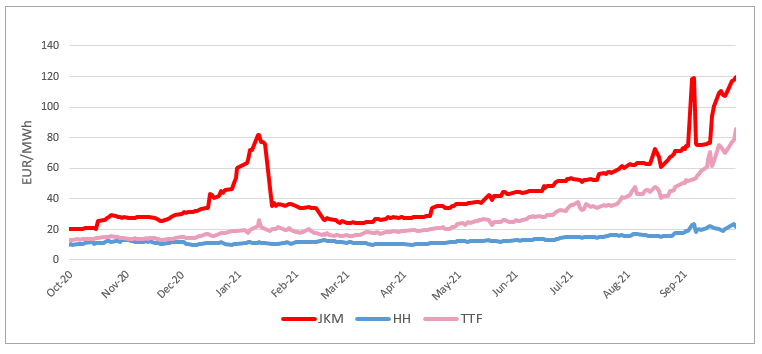
An increase in LNG deliveries is expected to offset the Russian shortage. However, at the moment, as shown on  Chart 7, the spread between the Asian JKM and the Dutch TTF makes the Asian market more attractive for LNG supplies, and this spread is widening as winter approaches, sometimes reaching as high as EUR 20. This is due to the rising demand for energy in Asia following the COVID-19 crisis and the increasing utilisation of gas-fired power plants.

Chart 7: The front month prices on TTF, JKM & Henry Hub

Outlook

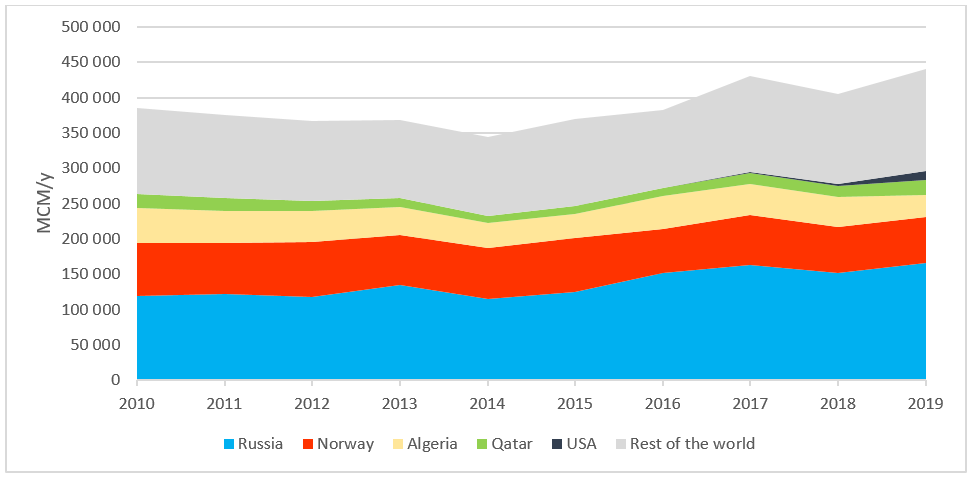
Europe's current dependence on natural gas, and in particular on gas imported from Russia, is illustrated on Chart 8. The natural gas, which is still the second largest energy source in the EU (22% of its energy mix in 2019), accounts for a significant share of the EU's energy consumption. The largest share of imports of this energy carrier (40%) comes from Russia, so the questions regarding Russian imports are far from trivial in terms of the volumes destined for Europe, and hence the price of European gas.

Chart 8: EU27's natural gas import by source country (2010-2019)

The Balkan section of the TurkStream route to Hungary started operating on 1 October, but Russia is not expected to extend its gas supply contract with Ukraine until 2024. It is now safe to conclude that Russia plans to supply its European customers via Nord Stream 1-2 and Yamal pipelines and the Balkan route in the coming years, and to eliminate the Ukrainian route in the long term. In principle, Hungary will not lose its position as a transit country, but apart from the LNG terminal in Krk, the region will continue to depend mainly on imports from Russia. Poland is not expected to extend its long-term contract with Russia, which expires in 2022. In order to reduce its dependence on Russian imports, Poland is just building the Baltic Pipe, new interconnector to Slovakia and Lithuania will be developed and a new floating LNG terminal will be built in addition to the expansion of the existing one. In Russia, the possibility of allowing companies other than Gazprom to transport through the Nord Stream 2 pipeline to comply with EU regulations is currently being explored, but the process of amending the legislation is expected to take a long time. The price of natural gas on European markets has briefly crossed the historic 100 EUR/MWh mark and it is not clear at this stage when we will return to the price levels we were used to until Nord Stream 2 comes on stream and imports from Russia return to normal levels. At the same time, forecasts of a colder than average winter at present could further stimulate expectations of a high price environment.

  ---

HU version below ↓↓↓
A cikk magyar nyelven Tovább kattintva lentebb olvasható.

Tovább

Fit for 55 minutes

HU version below ↓↓↓
A cikk magyar nyelven Tovább kattintva lentebb olvasható.

 ---

4 minutes reading time ||| 4 perc olvasási idő

EN version

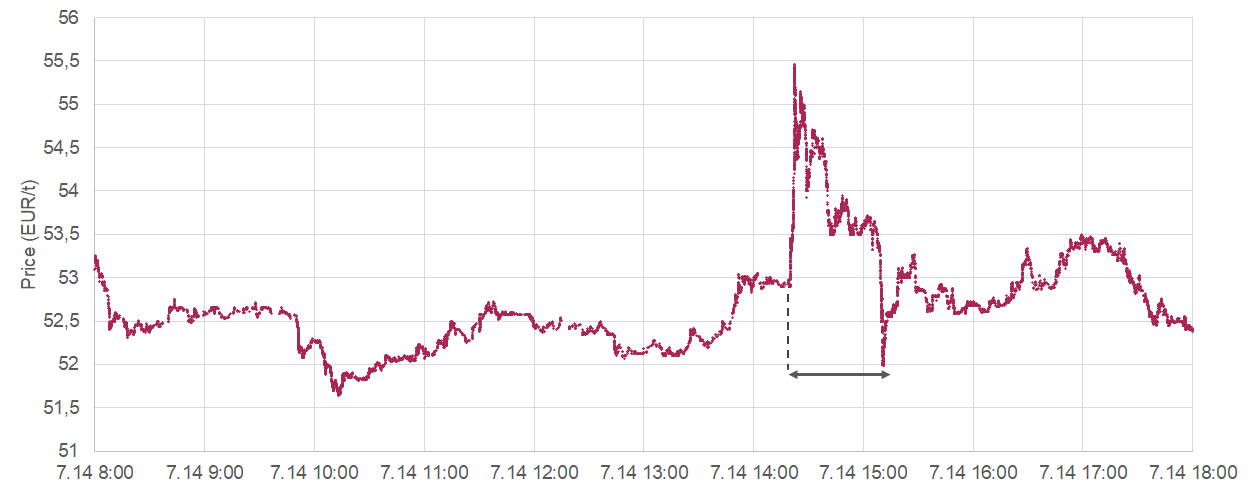
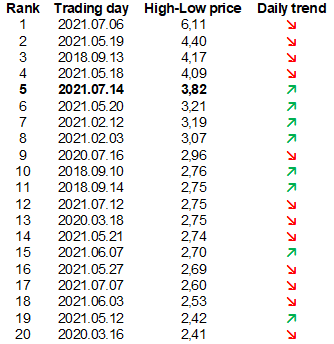
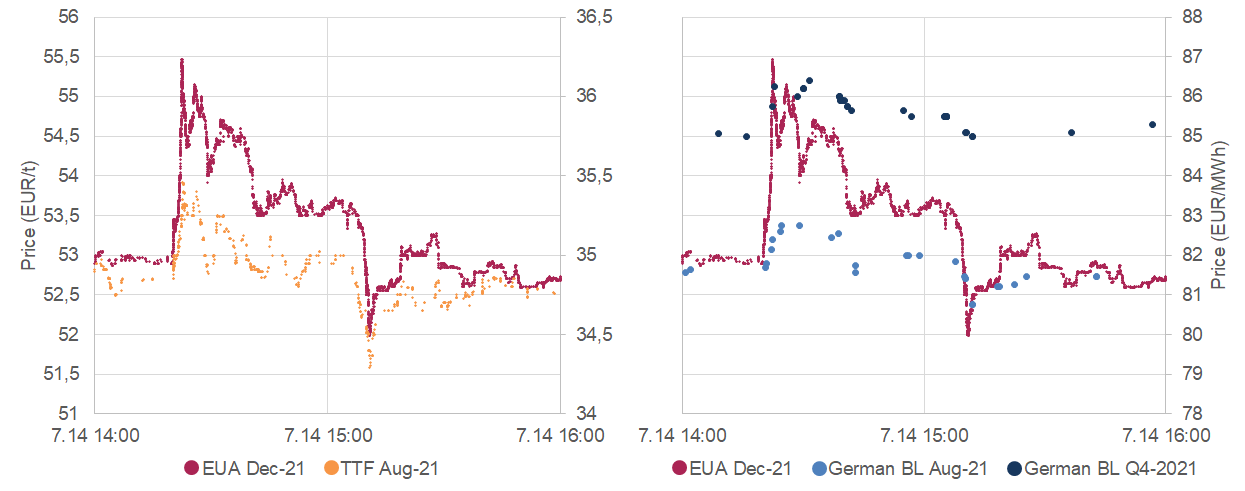
'Fit for 55' package is the latest major energy package since the intangible European Green Deal and the fourth energy package (Winter Package or Clean Energy Package as you wish). The package was announced on 14th July, however earlier some leaks resulted the EUA Dec-21 price reaching 58 EUR/t highs and then falling under 51 EUR/t in a couple of hours. One would say these are pure speculations, but the news processing speed of the traders here is what really matters. This was particularly true on the 14th July, when at 14:20 the European Commission announced the Fit for 55 package. Market reaction was unprecedented.

Prices jumped from 53 EUR to 55.5 EUR within 2 minutes. After processing the details of the news, market started correction and even turned around falling to 52 EUR in just 55 minutes.

Chart 1: EUA Dec-21 trade prices on 14th July

The 55 minutes of news processing put 14th July among the most volatile EUA sessions. Only bearish free falls overtake 14th July. Noteworthy that besides a couple of exceptions, most of the volatile sessions occurred in the first half of 2021.

Beyond carbon market, correlation transforms into causality. Both power and natural gas markets tracked the bullish moments of EUA, subsequently prices fell again together. Taking an even closer look Aug-21 TTF price followed the drop of CO2 price in just a few seconds, while the delay between German baseload power and CO2 prices was a little longer.

Chart 2: EUA, TTF and German baseload power trade prices on 14th July

What do these 55 minutes tell us?

The latest months brought significant volatility to the commodity markets, mostly driven by the expectation of ETS reform. At the same time algo trading is determining commodity markets more and more, especially the liquid ones. These algorithms can be triggered even by keywords, which can be followed by other triggers, like 'buy at a certain level'.

In the context of the current article, it is pointless to analyze the expectations of EUA prices. What's for sure is that the day of 14th July showed that commodity markets are truly connected and much faster driven by news and algorithms than ever before. Furthermore the CO2 market moves not just Western European power and gas prices, but CEEGEX, HUPX and HUDEX too.

 ---

HU version >>>
A cikk magyar nyelven Tovább kattintva lentebb olvasható.

Tovább

Why are these high gas prices so low?

Miért ilyen alacsonyak ezek a magas gázárak?

HU version below ↓↓↓
A cikk magyar nyelven Tovább kattintva lentebb olvasható.

 ---

8 minutes reading time ||| 8 perc olvasási idő

EN version

European natural gas prices have risen from record low levels to multi-year high as TTF climbed from 3 EUR/MWh to 28 EUR/MWh in a 12 month period. Among this bullish environment a shifting trend outlines: the East-West spread flipped. Historically Central Europe and particularly Hungary has always been a premium market compared to Western European hubs, so Hungarian gas prices are now lower than previously expected.

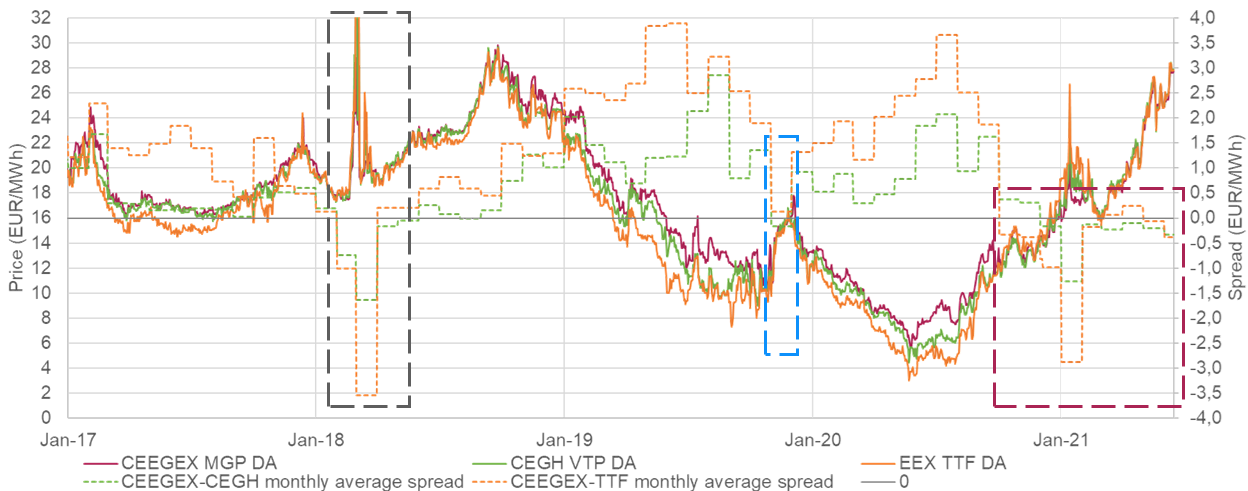
Chart 1: Western European and Central European gas prices and monthly spreads

Chart 1 shows the historical perspective of the current discount - highlighted in the red rectangle - compared to previous periods:

  1. Almost 9 months of discount from October 2020 and ongoing
  2. 2-3 months in 2018 due to extreme weather called 'Beast from the East' (grey rectangle)
  3. <1 month at the end of 2020 as the risk of Ukrainian supply disruption led to record gas volumes in the Central European storages (blue rectangle)

In this article 3 major reasons are shown among the possible consequences.

1. New sources brought change in the regional gas flows

After years of planning the Croatian LNG terminal started its operation on 1st January. At the same time the Croatian-Hungarian interconnector became significantly bidirectional. Besides a smaller period in February-March, the LNG terminal in Krk served as a key supply source for the CEE region and particularly Croatia. Notably in Q2 2021 the utilization of the Croatian LNG terminal is around 70%, while the European average is merely below 50%.

Another Southern route development - the onshore extension of TurkStream - is still ongoing, however in January a major milestone has been reached as gas started to flow from Bulgaria to Serbia. Quantities which historically came via Ukraine and Hungary, now come via Turkey and Bulgaria.

Chart 2: Croatian and Serbian gas flows

These two routes together decreased the demand in Hungary and as a consequence new supply options emerged. Such a change has been foreseen for years, however the price implications are visible only now. A key difference between TurkStream and the Ukrainian route is that via Ukraine the volumes transit through various countries (majority via Slovakia and Baumgarten, Austria, smaller portions via Poland and Hungary). With TurkStream, besides a smaller Romanian connection the majority of gas will land on Hungary, which possible outcome will alone transform the position of each country in the region.

2. Hungarian and Ukrainian gas storage levels are well above the ones in the West

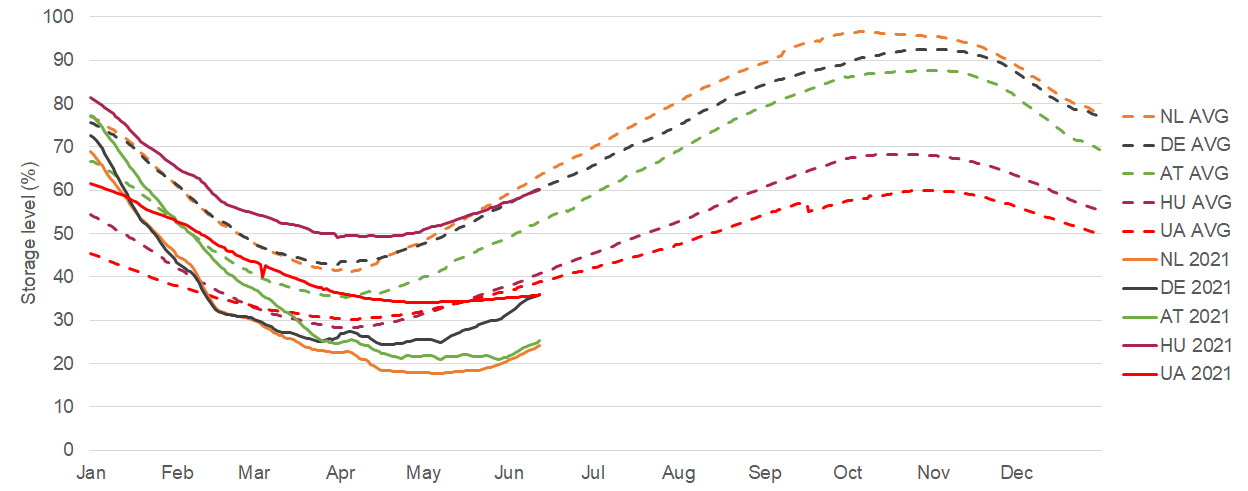
Storing gas is like preparing for the worst: market participants expect late winter cold spells, however in an average year more than enough quantity remains in storage. 2021 is not like an average year having highly depleted gas storages. Even in May an average of 500 GWh gas was withdrawn from European gas storages. Yet the storage utilization was highly dependant on the local weather and regional supply situation (e.g. Western European LNG supply remained moderate and pipeline supply from North Africa strengthened). Chart 3 shows the huge difference from West to East.

Chart 3: Major gas storage levels from the Netherlands to Ukraine

Major Western European storage markets, like the Netherlands, Germany and Austria are well below their 2011-2020 average levels. Meanwhile Ukrainian gas storage is just at its average, while Hungary is well above the level of last decade. Of course even the Hungarian and Ukrainian storages are below the past few years levels, but the whole storage landscape is again a key fundamental, which underlines the flip in the spread.

3. Coal to gas switch is limited in Central-Europe

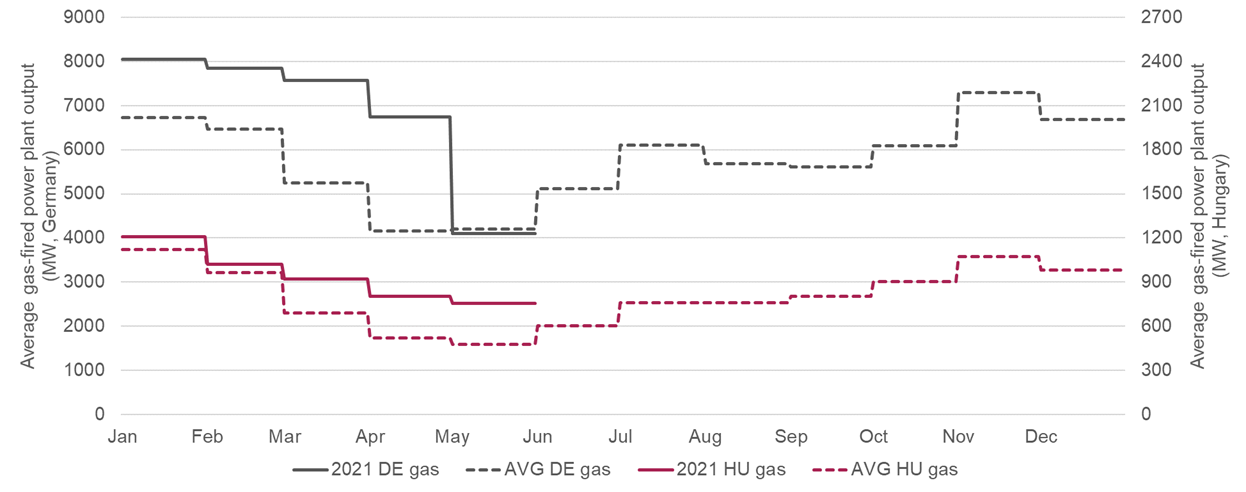
Last, but not least, the record high EUA price as a result of tightening environment policies also affects European gas markets. It's natural that the power and gas market correlation varies across the region. The coal to gas switch potential is higher in Western Europe than in Central Europe (besides Poland), as both the utilized coal capacities and standby gas capacities are larger. Chart 4 shows the average gas-fired power plant output in Germany and Hungary, thus the level of natural gas consumption in power plants (without taking into account the efficiency of these power plants).

Chart 4: Gas-fired electricity generation in Germany and Hungary

In 2021 growth of natural gas demand is higher in Germany compared to 2018-2020 average not just in absolute terms but as a percentage change. While the publication of final gas consumption data still awaits, it can be stated that the increase in demand has been uneven across Europe.

Possible consequences and outlook

Hungary has recently been priced as VTP + spread or TTF + spread. However the continuously occurring discount should transform pricing strategies as it will be unfeasible for both consumers and traders without proper hedging  activities. CEEGEX operates a trading platform with stable liquidity in the region, thus this is a real chance for Hungarian indices to evolve. After these massive infrastructure development with the right regulatory incentives consumers should benefit the most.

A key question is that how long the flip of the spread will last and how often it will happen again. My hard guess is that the best is yet to come. With the development of Serbian gas corridor, the Hungarian-Serbian interconnector becomes bidirectional from 1st October. As an addition the favorable storage regime in Ukraine (e.g. short-haul and custom free for 3 years) will let market participants exploit the Central European infrastructures. So even when the gas prices are high, the Central Eastern European region can remain lower than TTF or VTP.

 ---

HU version >>>
A cikk magyar nyelven Tovább kattintva lentebb olvasható.

Tovább
süti beállítások módosítása